 Photo Credit: Aleksandr Davydov / Alamy Stock Photo
It’s a great time to be entering the workforce or looking for a new job. According to the New York Fed, the job market for young people, and especially college graduates, is the strongest it’s been since the 2008 Recession. Overall unemployment currently stands at 4 percent, dipping to 3.7 percent for recent graduates and just 2.3 percent for all college graduates. Similarly, underemployment for recent graduates, which is common for young people entering the workforce, has decreased by more than three percentage points from June 2014 to June 2018, suggesting that young graduates are not just finding “a job,” but rather, they’re finding jobs that match their skill level.
Of course, not all locations across the U.S. have the same employment opportunities, and employment rates are only one part of the equation when choosing a city to jumpstart your career. Unemployment rates vary from city to city, as does cost of living (especially housing), income, and demographics. If you are a millennial looking for the best cities for young professionals, it’s important to find one that’s affordable, has jobs, and is home to plenty of people close in age.
To find the best cities for millennial job seekers, Jetty commissioned research to analyze the largest 150 metropolitan areas in the U.S. It’s researchers looked at average millennial income, cost of living, unemployment, millennial population growth, and millennial share of the workforce using data from the U.S. Census Bureau, U.S. Bureau of Economic Analysis, and Zillow.
Jetty found that many cities outside of notoriously high-priced New York and San Francisco—especially cities in the South and Midwest—offer compelling (and affordable) opportunities for millennials entering the workforce. Interestingly, while New York did not make the top 25 list of best cities for millennials to work, San Francisco and San Jose rank in the top three spots despite substantially higher living costs. For many, the Bay Area’s extremely high salaries, low unemployment, and influx of millennials outweigh its high prices. If that’s not for you, look to the many other more affordable options below. Here are the 25 best cities for millennial job seekers.

Photo Credit: 4k-Clips / Alamy Stock Photo
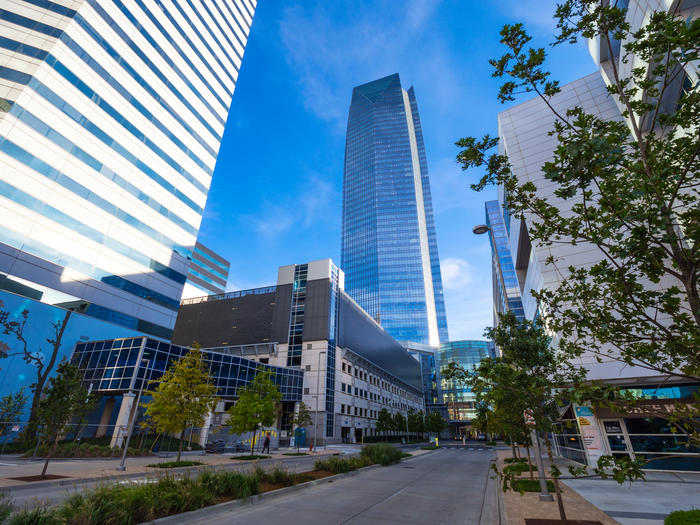
25. Oklahoma City, OK
- Average millennial income: $34,214
- Cost of living: 8.4% lower
- Median rent (2–bedroom): $807
- Overall unemployment: 3.6%
- 5-year change in millennial population: No change
- Millennial share of workforce: 40.7%

Photo Credit: Sean Pavone / Alamy Stock Photo
24. Hartford-West Hartford-East Hartford, CT
- Average millennial income: $36,895
- Cost of living: 1.5% higher
- Median rent (2–bedroom): $1,300
- Overall unemployment: 4.3%
- 5-year change in millennial population: 5.10%
- Millennial share of workforce: 34.9%

Photo Credit: Sean Pavone / Alamy Stock Photo
23. Cleveland-Elyria, OH
- Average millennial income: $32,910
- Cost of living: 9.8% lower
- Median rent (2–bedroom): $908
- Overall unemployment: 4.9%
- 5-year change in millennial population: 4.50%
- Millennial share of workforce: 34.9%

Photo Credit: Sean Pavone / Alamy Stock Photo
22. Milwaukee-Waukesha-West Allis, WI
- Average millennial income: $34,501
- Cost of living: 4.4% lower
- Median rent (2–bedroom): $987
- Overall unemployment: 2.8%
- 5-year change in millennial population: No change
- Millennial share of workforce: 37.4%

Photo Credit: Michelle Himes Studio / Alamy Stock Photo
21. Columbus, OH
- Average millennial income: $34,838
- Cost of living: 7.0% lower
- Median rent (2–bedroom): $1,053
- Overall unemployment: 3.5%
- 5-year change in millennial population: No change
- Millennial share of workforce: 40.0%

Photo Credit: Sean Pavone / Alamy Stock Photo
20. Philadelphia-Camden-Wilmington, PA-NJ-DE-MD
- Average millennial income: $36,574
- Cost of living: 5.9% higher
- Median rent (2-bedroom): $1,455
- Overall unemployment: 3.7%
- 5-year change in millennial population: 1.10%
- Millennial share of workforce: 36.5%

Photo Credit: Alex Holder / Alamy Stock Photo
19. Minneapolis-St. Paul-Bloomington, MN-WI
- Average millennial income: $39,276
- Cost of living: 2.3% higher
- Median rent (2-bedroom): $1,483
- Overall unemployment: 2.3%
- 5-year change in millennial population: -1.90%
- Millennial share of workforce: 37.5%

Photo Credit: CrackerClips Stock Media / Alamy Stock Photo
18. San Antonio-New Braunfels, TX
- Average millennial income: $28,778
- Cost of living: 5.6% lower
- Median rent (2-bedroom): $1,162
- Overall unemployment: 3.2%
- 5-year change in millennial population: 2.50%
- Millennial share of workforce: 41.2%

Photo Credit: Paul Brady / Alamy Stock Photo
17. Little Rock-North Little Rock-Conway, AR
- Average millennial income: $33,998
- Cost of living: 9.5% lower
- Median rent (2-bedroom): $713
- Overall unemployment: 3.2%
- 5-year change in millennial population: No change
- Millennial share of workforce: 38.2%

Photo Credit: J. G. Domke / Alamy Stock Photo
16. Lubbock, TX
- Average millennial income: $32,196
- Cost of living: 6.8% lower
- Median rent (2-bedroom): $842
- Overall unemployment: 2.8%
- 5-year change in millennial population: No change
- Millennial share of workforce: 47.8%

Photo Credit: Edwin Verin / Alamy Stock Photo
15. Amarillo, TX
- Average millennial income: $32,690
- Cost of living: 7.0% lower
- Median rent (2-bedroom): $821
- Overall unemployment: 2.6%
- 5-year change in millennial population: No change
- Millennial share of workforce: 41.2%

Photo Credit: Matt Bills / Alamy Stock Photo
14. Omaha-Council Bluffs, NE-IA
- Average millennial income: $35,990
- Cost of living: 6.6% lower
- Median rent (2-bedroom): $962
- Overall unemployment: 2.8%
- 5-year change in millennial population: -3.50%
- Millennial share of workforce: 37.3%

Photo Credit: Sean Pavone / Alamy Stock Photo
13. Austin-Round Rock, TX
- Average millennial income: $39,716
- Cost of living: Same as national average
- Median rent (2-bedroom): $1,396
- Overall unemployment: 2.8%
- 5-year change in millennial population: -2.70%
- Millennial share of workforce: 41.3%

Photo Credit: Sean Pavone / Alamy Stock Photo
12. Indianapolis-Carmel-Anderson, IN
- Average millennial income: $35,630
- Cost of living: 7.2% lower
- Median rent (2-bedroom): $895
- Overall unemployment: 3.0%
- 5-year change in millennial population: No change
- Millennial share of workforce: 38.0%

Photo Credit: Sean Pavone / Alamy Stock Photo
11. Charleston-North Charleston, SC
- Average millennial income: $36,285
- Cost of living: 3.8% lower
- Median rent (2-bedroom): $1,508
- Overall unemployment: 2.4%
- 5-year change in millennial population: -4.60%
- Millennial share of workforce: 41.0%

Photo Credit: Dave Newman / Alamy Stock Photo
10. Des Moines-West Des Moines, IA
- Average millennial income: $35,527
- Cost of living: 5.5% lower
- Median rent (2-bedroom): $967
- Overall unemployment: 2.1%
- 5-year change in millennial population: No change
- Millennial share of workforce: 38.3%

Photo Credit: Sean Pavone / Alamy Stock Photo
9. Nashville-Davidson–Murfreesboro–Franklin, TN
- Average millennial income: $34,960
- Cost of living: 5.6% lower
- Median rent (2-bedroom): $1,560
- Overall unemployment: 2.3%
- 5-year change in millennial population: No change
- Millennial share of workforce: 39.1%

Photo Credit: Sean Pavone / Alamy Stock Photo
8. Pittsburgh, PA
- Average millennial income: $35,168
- Cost of living: 5.7% lower
- Median rent (2-bedroom): $1,073
- Overall unemployment: 3.6%
- 5-year change in millennial population: 3.20%
- Millennial share of workforce: 34.6%

Photo Credit: Enrico Della Pietra / Alamy Stock Photo
7. Portland-South Portland, ME
- Average millennial income: $34,311
- Cost of living: 1.7% higher
- Median rent (2-bedroom): $1,492
- Overall unemployment: 2.4%
- 5-year change in millennial population: 4.20%
- Millennial share of workforce: 33.8%

Photo Credit: Cynthia Lindow / Alamy Stock Photo
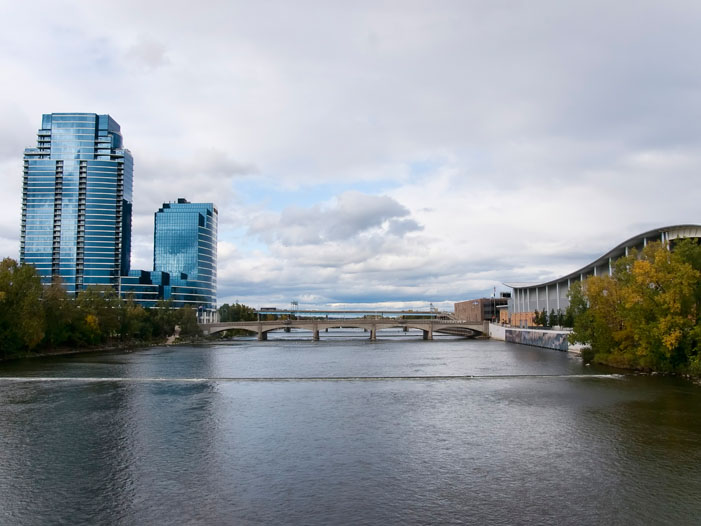
6. Grand Rapids-Wyoming, MI
- Average millennial income: $30,409
- Cost of living: 6.5% lower
- Median rent (2-bedroom): $981
- Overall unemployment: 2.9%
- 5-year change in millennial population: 4.40%
- Millennial share of workforce: 42.1%

Photo Credit: Roman Babakin / Alamy Stock Photo
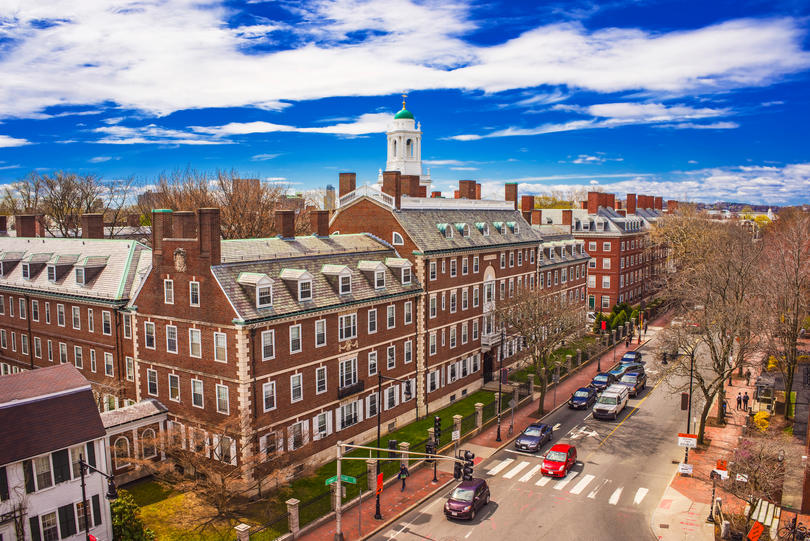
5. Boston-Cambridge-Newton, MA-NH
- Average millennial income: $42,501
- Cost of living: 11.1% higher
- Median rent (2-bedroom): $2,417
- Overall unemployment: 2.9%
- 5-year change in millennial population: 3.40%
- Millennial share of workforce: 37.3%

Photo Credit: Neil Podoll / Alamy Stock Photo
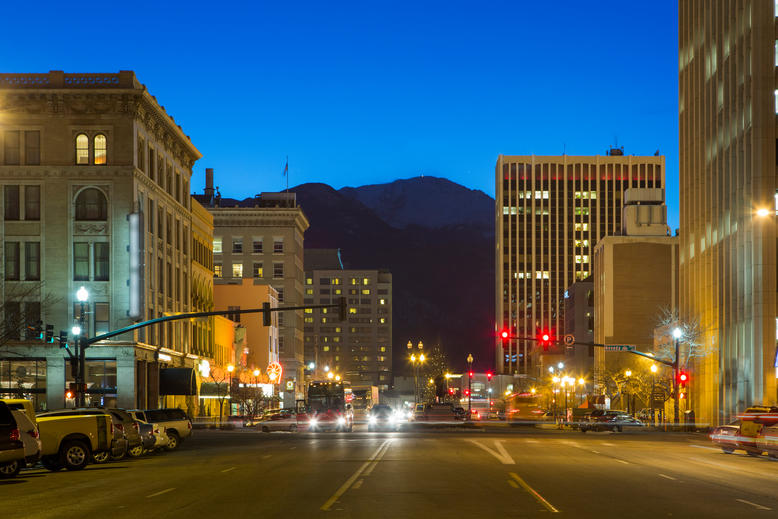
4. Colorado Springs, CO
- Average millennial income: $32,855
- Cost of living: 0.4% lower
- Median rent (2-bedroom): $1,265
- Overall unemployment: 2.8%
- 5-year change in millennial population: 4.60%
- Millennial share of workforce: 42.5%

Photo Credit: Yuval Helfman / Alamy Stock Photo
3. San Francisco-Oakland-Hayward, CA
- Average millennial income: $56,615
- Cost of living: 24.7% higher
- Median rent (2-bedroom): $3,000
- Overall unemployment: 2.4%
- 5-year change in millennial population: 1.40%
- Millennial share of workforce: 37.0%

Photo Credit: Yuval Helfman / Alamy Stock Photo
2. San Jose-Sunnyvale-Santa Clara, CA
- Average millennial income: $57,410
- Cost of living: 27.1% higher
- Median rent (2-bedroom): $2,935
- Overall unemployment: 2.3%
- 5-year change in millennial population: 2.40%
- Millennial share of workforce: 36.9%

Photo Credit: Aurora Photos / Alamy Stock Photo
1. Denver-Aurora-Lakewood, CO
- Average millennial income: $39,232
- Cost of living: 6.0% higher
- Median rent (2-bedroom): $1,737
- Overall unemployment: 2.3%
- 5-year change in millennial population: 1.80%
- Millennial share of workforce: 38.3%
Methodology
To identify the best cities for millennial job seekers, Jetty created a composite score based on the following metrics in order of importance:
- Average millennial income (30% – higher is better): Using data from the U.S. Census Bureau 2016 American Community Survey (ACS) 1-year Estimates, the average millennial income was computed for all employed individuals between the ages of 18 and 35.
- Cost of living (20% – lower is better): Using Regional Price Parities (RPPs) from the U.S. Bureau of Economic Analysis, cost of living differences were calculated for each metropolitan area. RPPs measure the geographical differences in price levels compared to the national average. RPPs used in this analysis are for 2016, the most recent available, and cover all consumer goods and services (including rents).
- Unemployment (20% – lower is better): Unemployment rates for each metropolitan area were sourced from the U.S. Bureau of Labor Statistics Local Area Unemployment Statistics. The data is for May 2018.
- 5-year change in millennial population (20% – higher is better): The change in the overall 18 to 35 population between 2011 and 2016 was calculated using data from the 2016 ACS 1-year Estimates. Changes were tested for statistical significance—”no change” is noted where applicable.
- Millennial share of the workforce (10% – higher is better): Also using data from the 2016 ACS 1-year Estimates, the millennial share of the workforce was calculated as the number of employed individuals 18 to 35 divided by the total number of employed individuals over 18.
- Median rent (0%): Median 2-bedroom apartment rents were sourced from Zillow. This data is not used in the overall score because rents are already factored into the Regional Price Parities. The data is provided for context; rents are from Q1 2018.
Only the largest 150 metropolitan areas were included in the analysis. Cities presented here are ordered by their overall composite score.
The content in this article is for informational and entertainment purposes only and is not to be viewed as legal and/or financial advice from Jetty or the author. A reasonable effort was made to ensure the accuracy of information contained in this article, but we provide no warranty, either express or implied, as to the accuracy, completeness, or usefulness of information. By using this information, you agree that Jetty and the author shall not be responsible for any errors or omissions contained in any material.

